Brief Overview
There are 25,264 restaurants included in the dataset for our analysis. For this analysis, we had to make several assumptions:
- The restaurant dataset included all restaurants in New York City.
- The scores in the restaurant dataset paint an accurate picture of restaurant cleanliness.
- The scores for each restaurant are independent and have no effect on the scores for other restaurants.
Mean Score by Cuisine Type

By taking the average scores for different cuisine types, we can clearly see that not all food is created equal. All the different cuisines vary in mean scores, which leads us to wonder why this happens. It is because of geographical location? Are most restaurants of a certain cuisine located in lower income neighborhoods? Does a restaurant or a cuisine’s popularity remove pressure from shop owners to strictly follow health guidelines since they know people will continue to buy their food? Or is it a matter of there only being restaurants that fall under a specific cuisine, and one restaurant’s high score is having a large effect on the category average?
Throughout our research and our work with this data, we tried to answer some of these questions by looking at geographic location data and how that affects a restaurant’s score. Do certain neighborhoods and zip codes score lower? And if so, is it because of income levels or because the restaurants don’t need to set high standards in that neighborhood (like tourist traps in Times Square)?
Just by looking at the graph above, we can begin to see a picture of which cuisines can be consistently ranked as safe, and which ones we might want to double check the score at before we go into the restaurant.
The cuisines with the lowest scores (lowest number of violations) are:
- Polynesian - 12.3
- Frozen Desserts - 13
- Bakery - 15.846
- Tex-Mex - 15.952
- Burgers - 16.152
- Delicatessen - 17.356
- Hot Dogs - 17.439
- Sandwiches - 17.786
The cuisines the highest scores (highest number of violations) are:
- Polish - 35.133
- Indian - 30.515
- Steak - 29.283
- Coffee - 27.475
- Chinese - 26.68
- Russian - 26.236
- Japanese - 26.087
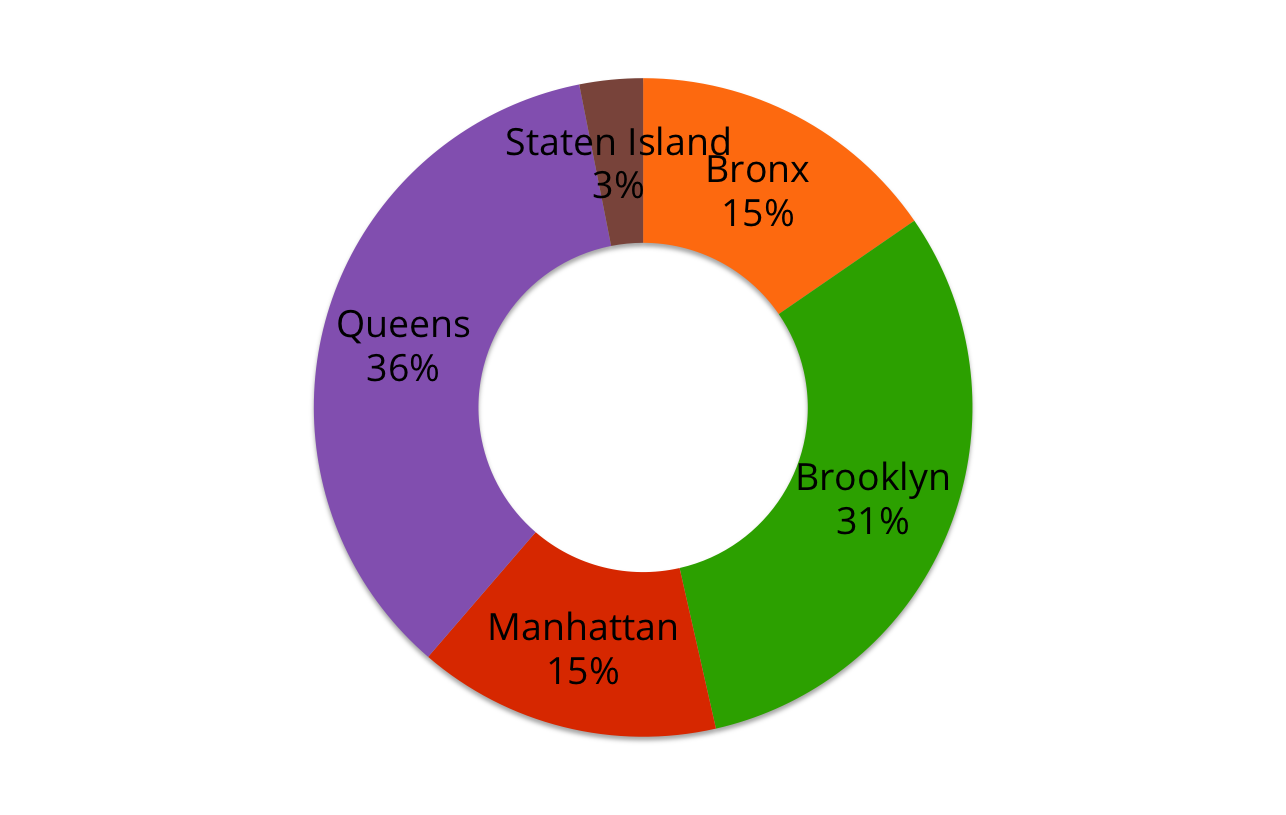
Mean Score By Borough

Scores and Geographical Location: What’s Going On?
As we went through our data we noticed that although the average ratings scores of the different boroughs were relatively similar, the average scores for individual zip codes varied greatly. To try and explore why these variations happen, we looked at income levels in different neighborhoods of New York City to see if there existed a relationship between zip code income and zip code food scores.


Although we did find a relationship between high food scores (high violations) and low income in a few zip codes throughout the city, this relationship was only apparent in zip codes with extremely low incomes, such as 10002 in Manhattan and was not consistent throughout. The factor that seems to have a stronger impact is not income in a specific geographical location, but instead the level of restaurant concentration in the given geographic location. The zip codes with the highest number of violations are also those that are in high traffic areas that are filled with retail and restaurant and are less residential. For example, some of the worst zip codes in Manhattan are 10012 and, as mentioned 10002. These two zip codes cover SoHo and Chinatown, which are both New York City neighborhoods with high restaurant concentrations. So, although income may have played a factor in Chinatown’s (10002) high violation numbers, high restaurant concentration may have played the stronger role. This is reinforced by zip codes in the other boroughs, as the zip codes with the highest scores were not necessarily the ones with the lowest incomes.
These patterns can be found throughout the other boroughs, as neighborhoods and zip codes that are considered more residential have lower scores. For example, the Upper West Side boasts relatively low scores and is known for being more residential, with a relatively small food and retail presence. At the same time the Upper East Side, which has a higher income but also a much higher number of food and retail options, has a higher score. Additionally, there are neighborhoods that are notorious for having low household incomes that garnered very low scores. East Harlem is one of these examples. Although the neighborhood is known for its low household income, its violation scores are one of the lowest in all of Manhattan.


These data findings show that it is not zip code income levels that predict how well restaurants will score during inspections, but instead restaurant density in that zip code. The more restaurants there are, the more opportunity there is for a restaurant to slip up and score poorly during an inspection. Once we also take into account that these average scores represent a restaurant’s total inspection history and not necessarily it’s current score, it becomes clear that the number of restaurants in a given geographical area is the greatest factor in determining the region’s average inspection scores.
Household Income By Borough

Median Income in New York
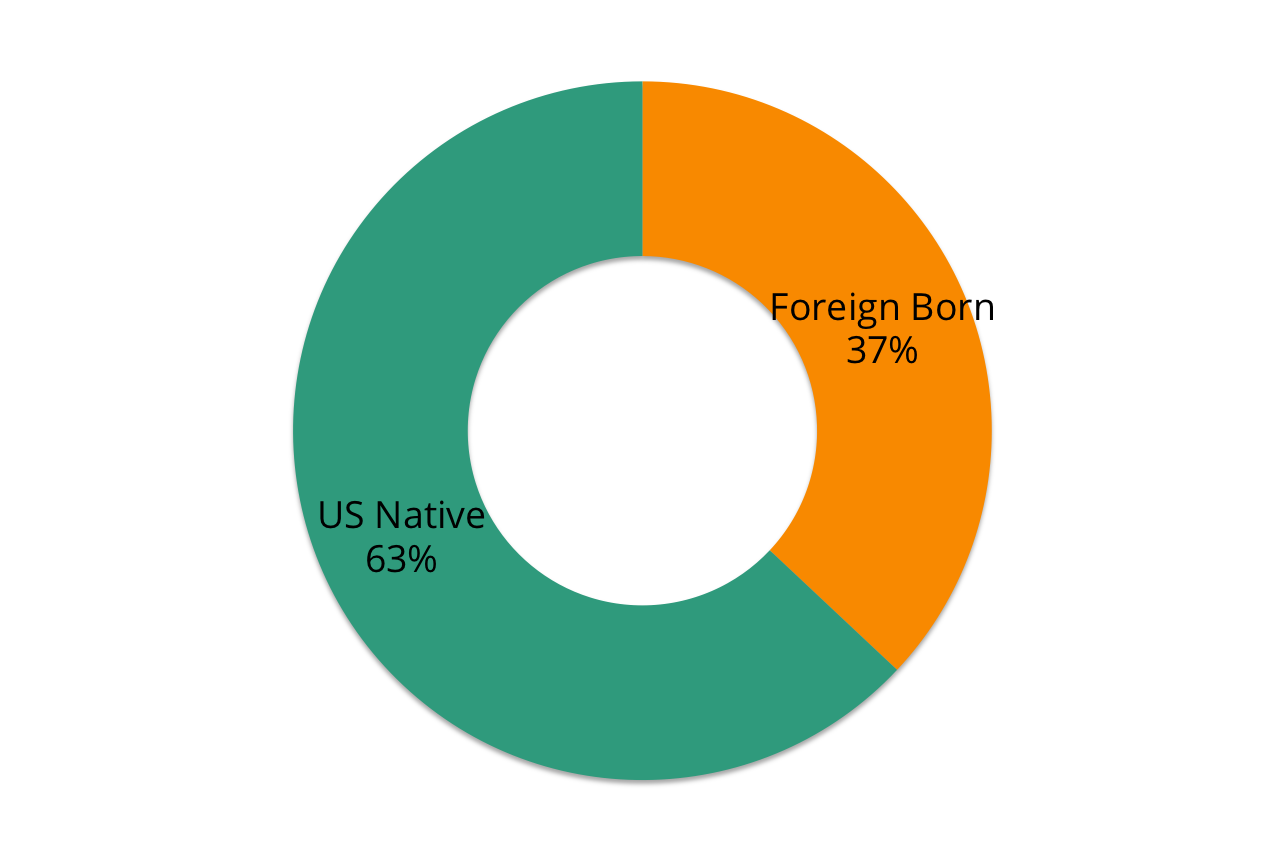
Foreign Born Population By Borough